Nifty Anlaysis

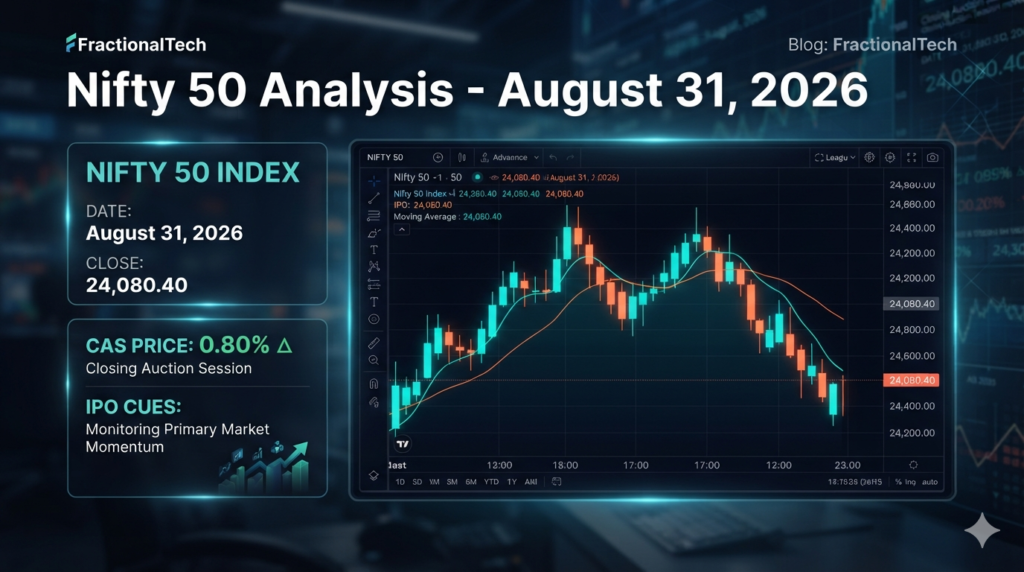
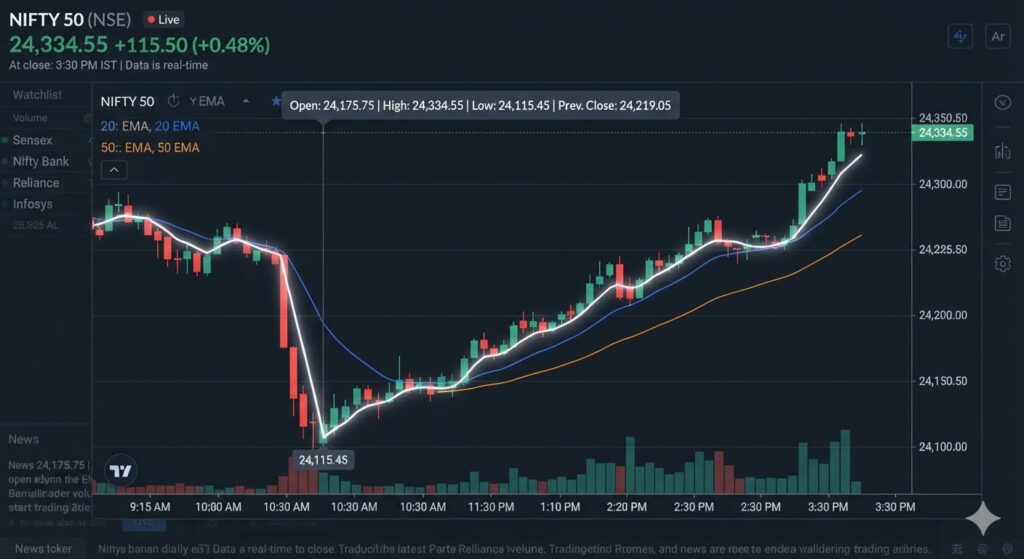
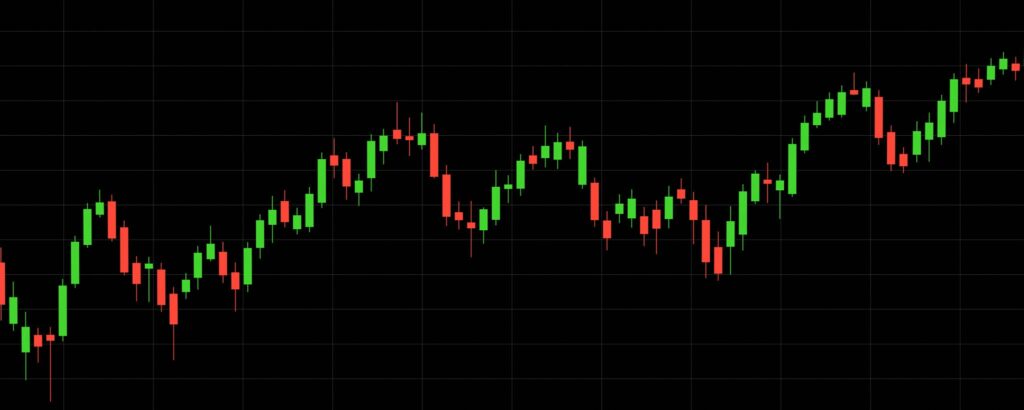
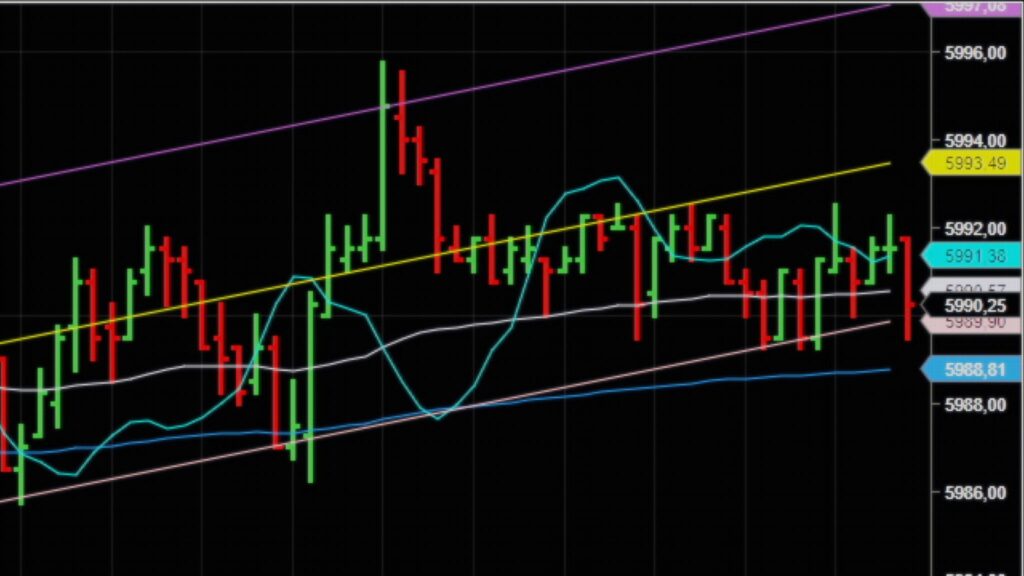
Stock trading candlestick chart illustrating Nifty 50 intraday recovery off 24,427 low to close at 24,614 during the Closing Auction Session on August 4, 2026.
Nifty Anlaysis

πŸ“Š Nifty 50 Market Analysis: Nifty Settles at 24,614 After Recovering 200+ Points Off Intraday Lows; Down 115+ Points Overall Ahead of RBI Policy

The Nifty 50 tumbled over 300 points intraday before staging a sharp 200+ point recovery during the Closing Auction Session (CAS) to settle at 24,614. Explore our complete breakdown of Dalal Street’s volatility, key technical levels for tomorrow, the RBI MPC policy schedule, major Q1 earnings, and IPO allotment guides.

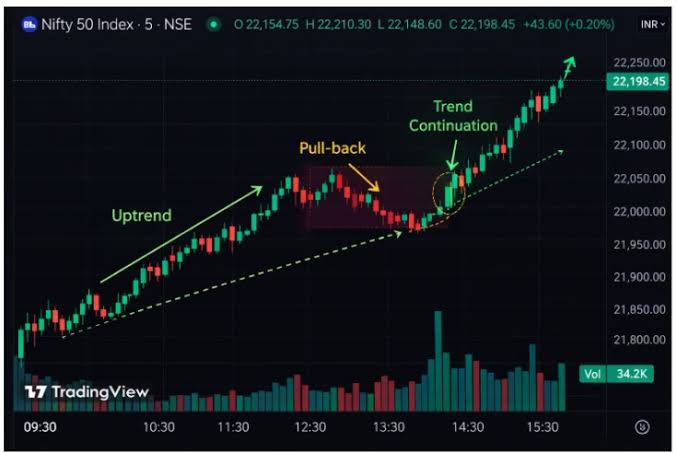
Stock market financial chart display showing Nifty 50 bullish candlestick movement.
Nifty Anlaysis

πŸ“Š Post-Market Wrap: Nifty 50 Rally, Q1 Earnings Scorecard & Tomorrow’s IPO Listing Outlook

The Nifty 50 surged +249 points to close at 24,233 as IT and consumer tech stocks led a strong rally. Read our complete post-market breakdown covering key technical levels for tomorrow, Q1 earnings reactions (Asian Paints, Dabur, Adani Ports), expected listing gains for Indo-MIM and Lohia Corp, and deep-dive analysis on the Manipal Health IPO

Scroll to Top